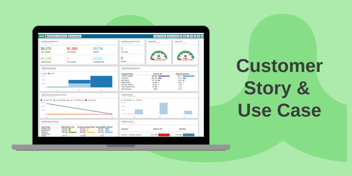
Unleash your business data superpower
As a business owner or manager, the questions before you are always: How do we improve productivity, how do we increase revenue, and how do we mitigate risks? You know that the success of your business rides on the actions you take to achieve those goals, your actions depend on the decisions you make, and making the best possible decisions needs accurate, reliable information about your business.
The problem is, your operating and accounting software generates so much data, it can be hard to know where to start. There’s crucial information about your business hidden in there that can help you make better decisions, take more appropriate actions, and just become an all-round, game-changing benefit to your business. You want to get hands and eyes on that information - business intelligence (BI) hands it to you on a silver platter.
At Wink Reports, we know that this is actually your secret business superpower. We’re here to help you understand the power of your business data, and unleash it!
What is business intelligence (BI)?
To put it simply, BI is the process of analyzing data to gain insights into your business and inform your decision-making. This data can come from various sources, such as your accounting software, inventory management systems, customer relationship management software, and more.
Through deep data analysis, it’s possible to uncover patterns, trends, and opportunities that can help you put your business on a healthy path forward.
Sounds like hard work, pulling that complex menu of business data together and making sense of it, doesn’t it? Of course you need a little help from a friend who understands what you’re trying to achieve. The way that Wink Reports can support your needs is that we make sense of your business data - we work with it, simplify and help you analyze it, and then create reports that uncover meaningful, actionable insights into your business.
Use Wink to access to the intelligence hidden inside your operating and finance data, historical data from your old business tools and live data from new tools that you’ve migrated onto, all blended together. This, in turn, gives you a range of insights across your business:
- You get a thorough overview of trends and fluctuations over time, and do more accurate forecasting.
- You can quickly identify potential risk because the metrics will give up her secrets by flagging any significant changes.
- You can set growth targets based on past performance - by team, company and whatever else you want to focus your attention and budget on.
Benefit from your BI
How exactly does a SaaS reporting tool like Wink Reports work for a business like yours? Easily. It practically, efficiently and reliably unlocks the potential of your business data.
For one thing, Wink Reports easily connects your operating and accounting software to the platform. Through software integrations, all your data sources can converge in one place where we merge the data and simplify it for you. It means you can start analyzing your data right away, without having to fork out a pile of dough on an integration specialist, or try to manually export and import data across different software applications yourself!
After a lifetime of tedious, resource-sucking manual data entry and calculations, having so much of this work automated is a definite crowd-pleaser. Using a power tool like Wink Report will not only save hours in your workday, it also goes a long way to reducing errors. In the end, it offers more reliable insights you can take to the bank.
Once the data is in and ready for analysis, all that’s left for you to do is create custom Wink reports, tailored exactly to your business needs or, in just a few clicks, you can be ready to go with our pre-built templates. You get a full, comprehensive overview of your business or you can dig into detailed, focused reports - either way, you’ll be able to easily identify trends and opportunities that you might have otherwise missed.
Let’s say you run a trades or field service company. You might have data from your job management software, tracking job details, labor hours, materials used, and such. You could also have data from your accounting software, tracking revenue, expenses, and cash flow. By connecting these data sources to Wink Reports, you can create reports that display your most profitable jobs, most-used materials, and your highest revenue-generating customers.
This will help you make better decisions about which jobs to take on, which materials to stock up on, and which customers to focus your marketing efforts on.
Smart reports, smart decisions
Another benefit of using Wink wizardry is flexible, spreadsheet-style reporting. You can literally customize your reports to fit your business needs. No more predefined, generic templates that don’t show the data you need now. With Wink Reports, you can go to town, creating pivot tables, charts, and graphs that help you visualize your data in truly meaningful ways. It means you quickly identify trends and outliers that might require further investigation, and respond quickly to changes or new requirements.
But how does Wink Reports help you mitigate risks involved in running your business? You know all too well there’s always a risk of supply chain disruption, cybersecurity breach, or natural disaster - you need to be prepared to deal with unexpected events that can impact your business. Forewarned is forearmed. Analyze the relevant data in Wink and use your reports to sketch possible scenarios in order to identify potential risks to your business (and the action to take) before they become major problems.
Let’s imagine a retail store owner or manager uses Wink Reports to analyze sales data, and begins to notice that sales of a particular product have steadily declined over the past few months. Could it be a sign that customers are losing interest in that product, or that a competitor is offering a similar product at a lower price? By identifying this trend early on, the store owner can take steps to mitigate the risk of lost sales by adjusting their marketing strategy or reducing inventory of that product.
Unlock your business potential
BI is all about using the data hidden inside your own operations and finances to the benefit of your business: to gain valuable, visual insights that improve your decision-making and planning; to help you mitigate risks and increase revenue.
If you’re keen to unleash your business potential, take advantage of our 30-day free trial and put Wink Reports to work for your business.
How has data helped you move your business forward? Leave a comment to share your insights with other business owners.


.png?width=450&height=300&name=Simpler%20reporting%203%20steps%20(2).png)