

We’re in the business of enabling our users with solutions that boost productivity and efficiency. Since its inception, Wink Reports has always been about providing a fun experience with tools that make it easier for business owners like you to create powerful reports.
The destination: the point at which you can unlock the powerful data in your business and prepare the reports you need to drive growth. The path: the ability to design, develop and deploy your own amazingly insightful reports with a simple, elegant, easy-to-use tool.
In lockstep with your business needs
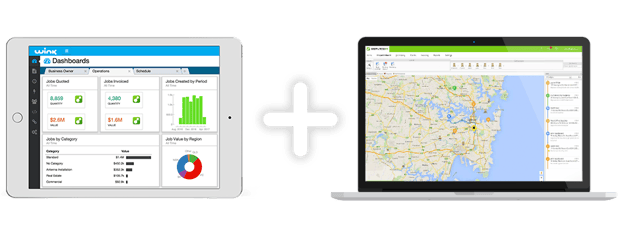
We’ve been hard at work developing such features as Dashboards, scheduled reporting via email and posting to Slack, APIs for our partners, connectors to Xero, ServiceM8, Unleashed, Vend, APE Mobile, Facebook and Google Analytics, and a whole lot more standard reports than you can imagine.
And here’s the latest fab addition to your Wink experience: the Wink Reports Designer.
The new Reports Designer, at your service
Excited as we are to announce its full release, we can’t do it without acknowledging our partners and willing users who’ve helped us out, busily beta testing the new features. Thanks to all of you for pointing out what and where to tweak and improve; thanks also for your time and patience ;)
The end result is that we can offer our users with an enhanced experience of preparing reports from all of the software packages mentioned previously.
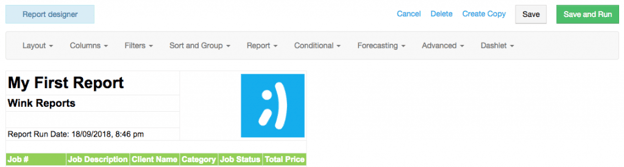
We’ve had lots of really useful feedback, and we’ve listened. So, we’ve created the Report Designer with your user-experience in mind.
- Data-focused, browser-based reports with your preferred export option (PDF, CSV or XLSX) are just one element you can now customize.
- More of a visual person? No worries. The new designer capabilities extend also to dashboards. You now have a selection of bar graphs, line graphs, key metrics, and endless color options to choose from to represent those all-important KPIs graphically.
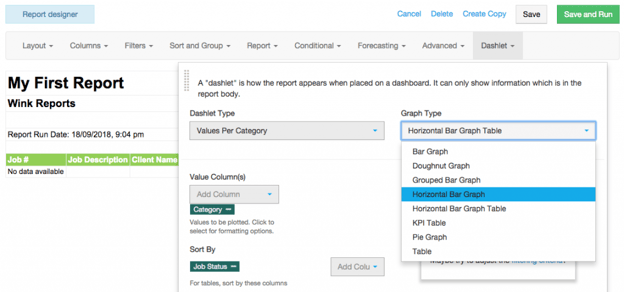
- How easy is it? The designer provides a live preview, which shows you the direct result of any change you made. Whether you do a simple column addition and reorder or more advanced formulas, filtering, sorting and aggregations, this nifty live preview feature will convince even the most data-weary (or wary) among us that it’s easy as apple pie.
Easily create powerful reports
Hope you have fun using your new Report Designer tool. Remember, we’re always available if you need a hand making the most of the new features.
If you’re reading this and you haven’t yet subscribed to Wink, what’re you waiting for? Sign up for our 30-day free trial and put Wink Reports to work for your business.
How has data helped you move your business forward? Leave a comment to share your insights with other business owners.

.png?width=450&height=300&name=Simpler%20reporting%203%20steps%20(2).png)