-2.png?width=900&height=450&name=Hubspot%20Blog%20Header%20Banner_1%20(900%20x%20450%20px)-2.png)
What’s one thing that can boost efficiency across your company and, ultimately, profitability? Instant access to correct and up to date operational data at any given time of the day.
Whether you’re using ServiceTitan or another software tool to run your business, it probably takes too much time and effort to rustle up the information you need. You might wonder how you’ll ever get that organized and share the info in a way that’s useful to your entire team…
In this article, we explain how easy it is to generate and display accurate business insights in one place where everyone can see everything, right on your office flat-screen television.
A dashboard communicates everything with everyone
The purpose of business intelligence (BI) is to tell the story of what’s happening in the company. It informs decision-making and profitable action.
Ideally, your BI tool should communicate actionable insights with everyone in your team. And if your operations cover a large geographical area, it should help you manage activities across multiple locations too.
What a dashboard is made of
Everything starts with data, the root of all the magic ;) Wink Reports partners with ServiceTitan to help users take control of their business data. Our software analyzes it, so you can track the metrics that matter most to you.
What kind of metrics? Appointment assignments, calls, customers, employees, equipment, estimate lines, invoices, job types, job materials, payments, purchase orders, technicians, timesheets, and far more besides. You can choose to drill down into minute detail or focus on high-level numbers. Either way, you get a comprehensive overview of your business performance.
Your dashboard organizes these insights into reports, summarizing them into snapshots of various aspects of the business.
What your dashboard could look like
This depends entirely on what’s important for you to have eyes on! A Wink dashboard is designed to deliver insights into trends and set targets based on past performance. As the system takes care of the advanced analytics, you can look forward to some stunning features.
- Visualized data
Visualizing patterns and trends in your revenue and expenses in speedometer or pie charts and graphs enables you to better manage seasonality, improve cash flow and overall growth.
- Real-time updates
Metrics updated in real time keeps the spread of knowledge within your business accurate. Your team can be proactive with potential risks and opportunities as soon as they emerge.
- Multi-source data
Connecting to and merging data from multiple business tools cover everything and just about anything in your business, past and present. Just imagine your sales, expenses, inventory, schedules, cash flow, performance analytics, and more, streamlined into a master dashboard.
- Detailed, easy-to-read reports
Simple, yet customizable reports you can actually understand strike the perfect balance between good old Excel-style spreadsheets and advanced, often confusing BI tools. Truly the best of both worlds!
Here’s how a ready-made ServiceTitan dashboard template works, and how to customize it.
Setting up your own dashboard
You’re in control. Create your own dashboard or build onto a ready-made template. As a ServiceTitan user, you might appreciate this guide to our Essentials dashboard.
How easy access to a master dashboard helps
One of our clients was keen to get a real-time KPI tracker. They wanted to use it to motivate sales consultants and keep the leadership team on top of their performance numbers.
Displaying their dashboard on screens across the company’s call centers kept Mr Antenna’s employees informed about what’s happening in the business from one minute to the next. They’ve found it a great time-saving, productivity-boosting bonus feature that their reports are updated in real-time.
You want this advantage for your business too, don’t you?

How full visibility on a master dashboard benefits you
If getting a real-time feel for the profitability of your company and staff matters to you, then this can be a huge enabler. You can literally see the health of your entire company (across all your locations) in a single Master Dashboard.
A pricing update workaround
Navigate to the Receipts tab under your Purchasing menu, click on the receipt number for the bill received from the supplier. Select the action to (re)create Bill. A list of items will appear where you can see the unit costs the supplier has charged you.
If anything differs from the info you have in your Pricebook, check with the supplier if all is correct or the reason for the price change. Once verified, you, your admin person or the accounts payable guy can then manually adjust the unit cost in the provided field.
Toggle that Update Pricebook button.
Make money-saving decisions faster
When your team is confident that the info in front of them is all correct and error-free, they can make sound decisions on the best action to take quickly and on the fly. There’s no risk of miscommunication, and no opportunities are lost.
Save time
Gone are the days of time-consuming manual data exports and import, yay! Simply plugging your numbers into a dashboard that works out of the box gives your efficiency levels a healthy boost.
Simplify data
The complexity of advanced analytics can be a bummer. But your master dashboard automates data reporting to display insights that are easy to understand. Updates are instant too, so you can just get on with the job and focus on moving the business forward.
Be consistent
A master dashboard makes the same insights consistently available to all account holders, wherever they’re based. Nobody’s left guessing about the state of business. It brings coherence, control and clarity to all operational areas, and improves multi-location management.
With ServiceTitan Mobile, your techs already have the benefit of accessing your master dashboard on their devices. You can close the loop by matching what they see on mobile with the info that everyone else in the company can see back at HQ. Ready to put that big flat-screen television in your office to better use?
Treat your company to a TV-friendly ServiceTitan dashboard
Wink Reports dashboards have a full-screen mode, which allows its content to be displayed on a 65" flat-screen television. Everyone from management and leadership down to the techs popping in and out of the office can access simplified reporting and data analytics they can actually understand. Nobody can complain about being left in the dark or missing the latest update on who’s hitting their KPIs.
Even if your company operates across multiple locations, there’s no longer a reason not to be on top of your numbers, because you can have your master dashboard displayed on a TV in every office.
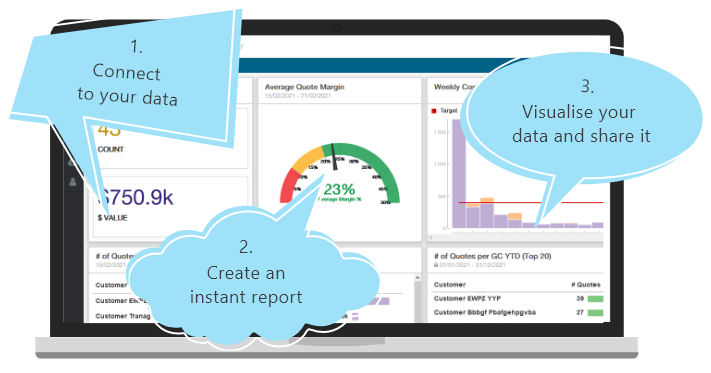
How to get your hands on it?
- Connect your ServiceTitan account to Wink Reports.
- Create and install a dashboard template.
- Project onto the office TV in stunning, full-screen mode.
Wink Reports integrates with all the main accounting and CRM tools. Once you connect, we import your historic data and run calculations on whatever your leadership team could possibly want to know.
To get that 10-foot overview of your company data that only a master dashboard can give you, sign up to Wink and keep everyone at the office tuned in ;)