Turn ServiceM8 data into profitable actions
Redshaw Constructions offer plumbing, drainage, earthmoving and engineering services. Based in Gatton, Queensland, with depots in Brisbane and Gatton’s Lockyer Valley, the company is family-owned and -operated, and committed to delivering cost-effective, reliable and professional services. Director, Nathan Bellshaw, told us how they use Wink to turn their data into actionable insights that drive their business forward.
Before Wink Reports
The challenge for Nathan was to get to the bottom of Redshaw’s profitability - to identify where they were making money and where they were losing it. He needed to understand the company's performance levels in order to identify areas for improvement and what activities they should keep doing.
Their reporting process used to be very manual. It was done in-house using the reporting functionality in ServiceM8, which they’d download into Excel to combine and explore. It cost too much time and didn’t deliver the answers Redshaw wanted.
Nathan needed quick, accurate visibility across their essential business data to help them make better decisions, and Wink delivered.
How Wink helped
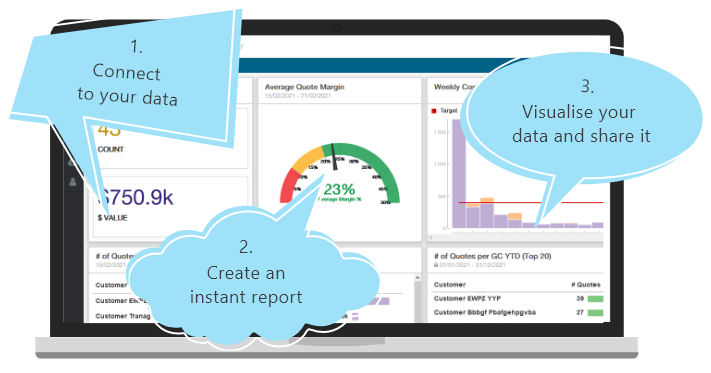
Nathan connected Redshaw’s various software tools to Wink, bringing all their data into one central place. Once the data was in Wink, he created reports that combined various sources to unlock visibility of all the factors impacting Redshaw’s profitability and growth. Not only could Nathan merge data sources in unique ways, but Wink pulled live data automatically from the connected sources, which saved hours of time and prevented human errors. Redshaw chose the Wink Professional plan to connect ServiceM8, Xero, Google analytics and Facebook, plus use File Import to upload data from Redshaw’s custom sources.
Reporting on profitability
The reports that Redshaw created in Wink, allowed them to make better-informed decisions that helped them reach record profitability and growth.
1. Job Profit reportsThese reports track revenue versus expenses over time to give Redshaw's team a very clear picture of the company’s overall profit.
2. Labor Efficiency reportsThese reports show the number of hours spent on a job based on the time clocked on and off in ServiceM8, which helps the team evaluate their efficiency rate.
3. Company Performance dashboardThe Redshaw team uses this template to display the number of jobs, won and lost.
4. Track Xero Budget Performance dashboardThis template provides a breakdown of ledger accounts to show cost or expenses versus revenue, which Redshaw uses to report on profit and loss.
5. Annual Hours dashboardThis dashboard displays employee efficiency levels and any trends indicating that internal processes are successfully increasing job efficiency.
6. Redshaw Monthly dashboardThis dashboard provides an overview of where the business is at, which parts of the business yield the most jobs and their conversion rates over time.
Connecting all the data
Wink made it possible for Redshaw to blend data from different software sources and also from different reports within ServiceM8 to produce unique insights. For example, by blending two ServiceM8 reports together, they were able to create one report that determined job efficiency.
By blending data from the ServiceM8 timesheets report together with data from the ServiceM8 appointments report, Redshaw could easily compare the time spent at jobs versus the time clocked on timesheets. This allowed them to manage labor efficiencies better.
Why Redshaw recommends Wink
Nathan uses Wink’s KPI dashboards to turn critical business numbers into clear, visual charts and gauges that make it easy to track performance and see where they can make improvements. By customizing reports to show only the info they needed, the Redshaw team could get straight to the point of where they’re making and/or losing money.
The ability to schedule reports to be sent has also been a great time-saver, especially since they can email reports directly to those who need them.
So, would the Redshaw team recommend Wink?
“110% for any other small service business.” - Nathan Bellshaw
Smashing goals
On the topic of risk and reward, Nathan cut to the chase: if Redshaw didn’t use Wink Reports, they would waste too much time trying to collate all the information they need to make profitable decisions. The amount of time and energy they’ve saved has been a huge improvement on the old manual process of exporting data required and creating reports.
As for their long-term goals, Nathan uses their Wink reports to help them:
- make strategic business decisions;
- reveal profitable sectors;
- track individual KPIs; and
- understand their overall business health and growth opportunities.
Stats don’t lie
1. ROI in one quarterWithin one quarter, Nathan secured a return on investment on Wink's annual Professional subscription just in terms of man hours saved from not having to export data from ServiceM8 to manually generate the reports they needed.
2. Labor efficiency up 27%Within one year, Redshaw improved their scheduling accuracy and reduced non-billable time to boost labor efficiency by 27%, achieved by tracking the hours scheduled on a job versus the actual hours spent doing the job.
3. Lost jobs down 70%Over one financial year, they reduced the number of jobs lost by a whopping 70% by tracking the ratios of jobs won to jobs lost and gaining a clear measure of the company’s success rate in converting potential jobs into actual wins.
4. Sales up 25%In one year, they increased sales by 25% by using Wink’s Sales by Sector report to identify the business sectors that generate the highest proportion of sales and using this information to make strategic decisions on targeted marketing.
Made for business owners
For Redshaw Constructions, Wink’s scheduled reports and dashboards have become business staples. They also rate Wink’s support service:
“11 out of 10. Fast response! Not only do you solve the problems I have, but you also explain the process, so that I can fix it myself on the next report I generate.” - Nathan Bellshaw
If you’re keen to unleash the power of your business data, take advantage of our 30-day free trial and put Wink Reports to work for you.
How has data helped you move your business forward? Leave a comment to share your insights with other business owners.